
What is a business capability map?
A business capability map is a hierarchical visualization of what an organization does—its stable abilities independent of org structure or IT systems. Capabilities describe outcomes the business must achieve, providing a durable vocabulary for strategy and investment discussions.
Capabilities Versus Processes and Organization
Capabilities answer what the business does—manage customer relationships, develop products, manage financial resources—while processes describe how work flows and org charts describe who reports to whom. Capabilities remain relatively stable when processes reengineer or departments reorganize, making them ideal anchors for multi-year planning.
A capability is defined by its outcome and business value, not by a single system or team. Customer service capability may span contact center, digital chat, and field service even when owned by different units.
Confusing capabilities with applications—labeling Salesforce as a capability—undermines maps. Applications enable capabilities; they are not capabilities themselves.
Capability taxonomies imported from acquisitions require merge rules—prefer broader enterprise definition, deprecate duplicates with mapping table.
Typical Map Structure and Levels
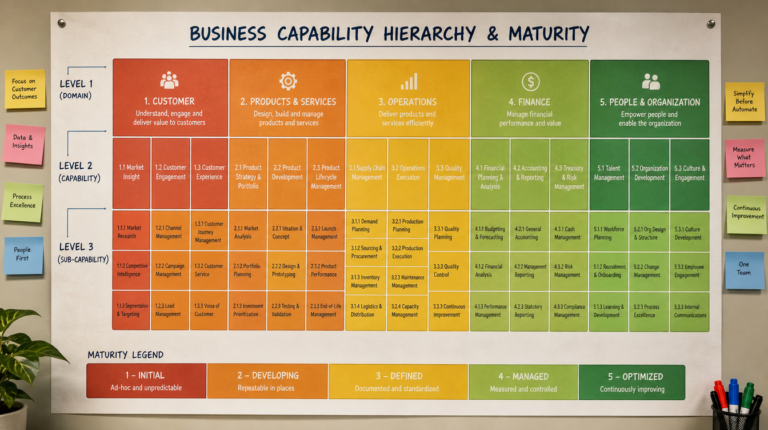
Maps organize capabilities hierarchically: Level 1 domains such as Customer Management, Product Management, Finance; Level 2 groups; Level 3 specific capabilities with definitions and owners. Depth stops when further breakdown no longer informs investment decisions—usually three levels suffice.
BIZBOK recommends clear naming—verb-noun or noun phrases—and definitions stored in repository. Maps may present as nested diagrams, tables, or interactive tools.
Industry reference models accelerate start points—healthcare, insurance, retail capability libraries—customized to enterprise context rather than copied blindly.
Board-level capability summaries highlight top five strategic capabilities and their status—condensed from full map detail.
Overlays and Cross-Mapping
Raw capability maps gain power through overlays: maturity scores, heat from stakeholder pain, investment spend, application support quality, regulatory criticality. Portfolio leaders see where to invest, rationalize, or remediate.
Mapping applications to capabilities exposes redundancy—five tools supporting same capability—and gaps—capability with no adequate system support. Data and technology overlays complete enterprise picture.
Larkinized LLC builds overlay dashboards executives use in quarterly portfolio reviews—not static posters.
Capability investment committees allocate funding pools by capability priority scores—not only by department lobbying.
Governance and Maintenance
Capability models require stewardship—business architecture team or community of practice approves new capabilities and definition changes. Ad hoc additions create synonyms and confusion—customer management versus client relationship management as duplicates.
Refresh triggers include major acquisitions, new business lines, or strategy pivots. Versioning preserves history for transformation tracking.
Link capability IDs to project charters and epics so funding traces to strategic building blocks.
External auditor walkthroughs use capability maps explaining control environment scope—reducing repeated explanation each audit cycle.
Common Pitfalls and Success Factors
Pitfalls include maps too granular (hundreds of meaningless capabilities), maps divorced from decisions (wall art), and IT-only development without business validation.
Success factors: executive sponsorship using capability language in planning, integration with EA repository, starting with workshop-based consensus on top two levels then refining.
Well-built capability maps become enterprise lingua franca—outlasting individual reorgs and technology fads.
Map visualization choices—nested boxes versus sunburst—should match audience; executives prefer heat over exhaustive trees.
Capability Map Communication Strategies
Larkinized LLC trains executives to use capability language in town halls and investor narratives—external consistency reinforces internal adoption. Maps displayed in portfolio war rooms—not only architecture wiki—signal operational importance.
Comparison to competitors via industry reference overlays shows strategic differentiation—which capabilities you must excel at versus table stakes—guiding investment tone.
Capability definitions include anti-patterns in glossary—what this capability is not—to reduce duplicate entries from teams protecting turf with synonym capabilities.
Advanced Capability Map Uses
War gaming competitive moves using capability maps reveals where rivals might attack your weak capabilities—informing defensive investment.
Innovation funnel tagged to capabilities ensures experiments strengthen strategic abilities—not random tech toys.
Regulatory change impact analysis starts with which capabilities and processes affected—maps accelerate compliance programs.
Capability-based budgeting allocates dollars to outcomes business leaders co-own—not only IT cost centers.
Practical Guidance from Larkinized LLC
Larkinized LLC publishes capability maps with governance: owners, refresh cadence, definition standards, and linkage to value streams—maps without governance become posters.
Board summaries highlight top strategic capabilities and status—condensed from full detail executives will not read but reference when challenging divisional funding requests.
Investment committees allocate pools by capability priority scores—reduces pure department lobbying masquerading as strategy when spend heat maps show misalignment.
M&A uses maps to compare coverage, plan consolidation, retire duplicates—due diligence accelerates when capability language precedes contract signing.
Visualization choices match audience—heat maps for executives, hierarchical trees for planners—one diagram rarely serves all stakeholders effectively.
Taxonomy merge rules for acquisitions prevent duplicate capability names confusing portfolio analytics for years after close.
Capability definition glossary resolves naming disputes before workshops escalate—shared verbs and nouns reduce forty percent of facilitation time in mature programs.
Larkinized LLC connects guidance on what is a business capability map to named portfolio decisions within the current fiscal year so architecture work is legible in funding systems executives already use. Workshop outputs publish to the repository within two weeks with owners assigned, preventing loss of context when facilitators rotate or consultants depart after initial engagement.
Cross-functional participation includes operations staff who execute daily processes—not only senior leaders whose high-level views omit workarounds that define real performance. Their input grounds models in operational truth and reduces downstream rejection when delivery teams claim architecture ignored how work actually happens.
Education scales beyond central architects through micro-learning for product owners, procurement staff, and engineers, reducing exceptions driven by ignorance rather than genuine strategic conflict. Office hours and internal communities of practice keep guidance current as cloud, agile, and AI practices evolve faster than annual training cycles.
Measurement pairs business KPIs—cycle time, cost per transaction, error rates, regulatory findings—with architecture metrics such as repository usage, review SLA compliance, and portfolio alignment scores. Improvements tied to architecture interventions build executive trust more reliably than model counts alone.
Regulatory and audit stakeholders increasingly expect traceability; viewpoint-specific views linked to repository entities produce evidence in days rather than weeks during examinations. Proactive documentation reduces fire drills, punitive findings, and leadership distraction from core transformation priorities.
M&A, divestiture, and market expansion stress-test architecture assets—scenario playbooks updated annually let leadership pivot with cost and timeline estimates instead of panic discovery after announcements. Capability maps and application inventories become due diligence assets before deals close, not afterthought spreadsheets.
Governance forums for what is a business capability map should meet on a predictable cadence tied to portfolio and release planning—not ad hoc when crises force attention. Larkinized LLC recommends standing architecture review slots with published intake criteria, SLA targets, and escalation paths so delivery teams know how to engage without treating architecture as unpredictable gatekeeping that rewards political access over merit of design.
Traceability from strategy statements to capability or architecture elements to funded initiatives to deployed solutions closes the loop executives expect when they approve EA funding. Without traceability, architecture remains a parallel documentation universe. Link charters, requirements, design records, and operational inventories in one searchable repository so auditors, product managers, and engineers retrieve consistent answers instead of conflicting spreadsheets maintained in silos.
Risk management benefits when what is a business capability map practices identify concentration risks—single vendor platforms, fragile integrations, key-person dependencies, regions without failover—and map mitigations into migration plans with owners and dates. Risk registers integrated with architecture repositories beat oral tradition during incidents when leadership demands answers within hours and teams cannot afford heroic manual discovery across dozens of systems.
Innovation programs need explicit guardrails within what is a business capability map so experiments proceed safely: sandbox environments, data masking rules, time-boxed pilots, and kill criteria before production commitments. Architecture enables innovation velocity by stating what teams may try without enterprise approval versus what requires board-level review because customer data, financial reporting, or safety-critical operations are affected.
Global enterprises localizing what is a business capability map should tier standards: mandatory worldwide, recommended regional, optional local—documented in governance charters to prevent both harmful divergence and rejection of valid regional regulatory requirements. Regional architects on a council synchronize proposals before they become de facto standards that conflict with enterprise principles approved by executive sponsors accountable to the board.
Quality assurance for architecture artifacts includes peer review, automated validation where schemas exist, and executive readability checks before publication. Larkinized LLC teaches teams to reject diagrams that look complete but lack definitions, owners, and measures—hallmarks of documentation theater that erodes trust faster than publishing fewer, higher-quality views updated on schedule.
Stakeholder onboarding for what is a business capability map never ends; annual refreshers for new leaders, rotating product managers, and engineers hired from acquisitions prevent repeated violations caused by ignorance rather than defiance. Micro-learning, office hours, and annotated examples in repositories scale literacy without requiring week-long courses that busy executives and engineers will not attend consistently.
Ultimately what is a business capability map succeeds when leaders reference architecture evidence in routine decisions—funding, hiring, vendor selection, incident response—not only during transformations. Larkinized LLC measures cultural adoption through decision log sampling: what percentage of major investments cited architecture assets in approval packets last quarter? Rising percentages indicate durability; flat or falling percentages signal sponsorship or relevance problems requiring honest retrospective, not additional templates.
Larkinized LLC closes each engagement on What is a business capability map with a written adoption plan: owners, refresh dates, metrics, and executive checkpoints—so architecture value persists after consultants depart and survives leadership changes that otherwise reset informal progress.
Executive sponsors should reference What is a business capability map artifacts in quarterly business reviews—not only during transformation launches—so teams perceive architecture as ongoing operating discipline rather than temporary program overhead tied to a single initiative code.
Procurement and legal partners benefit when What is a business capability map standards appear in contracts and RFP templates early, reducing vendor proposals that ignore integration, security, and data requirements—rework after award is far more expensive than clarity during sourcing.
Business Capability Map Structure
Hierarchical capability map with Level 1 enterprise domains, Level 2 capability groups, and Level 3 granular capabilities—linked to applications, data, and metrics via overlays.
Key Takeaways
- Capability maps show what the business does—stable abilities independent of org structure and systems.
- Structure typically uses three hierarchical levels with clear definitions and ownership.
- Overlays for maturity, investment, and applications turn maps into portfolio decision tools.
- Govern definitions centrally and refresh when strategy or structure shifts materially.
- Avoid application names as capabilities; focus on business outcomes and value.
References & Further Reading
- Business Architecture Guild, BIZBOK Guide — Business Capability Mapping
- The Open Group, TOGAF Standard — Capability-Based Planning
- McKinsey & Company, Capability-driven transformation
Need Expert Guidance?
Larkinized LLC helps organizations design, govern, and execute enterprise architecture programs that deliver measurable business outcomes.